Retired Document
Important: This document may not represent best practices for current development. Links to downloads and other resources may no longer be valid.
Examining File-System Usage
OS X comes with several tools for examining how your application uses the file system. You can sample your application to see what file-system calls it makes. You can watch the file-system calls at the system level and you can examine overall file-system statistics.
As you gather information, consider using multiple tools to gather your data from different angles. Both Shark and fs_usage can provide a lot of information about your application’s file-system interactions, but that information is typically very complimentary. Seeing the same behavior in different ways can provide you with better data for isolating the real problems.
Sampling File-System Usage Selectively
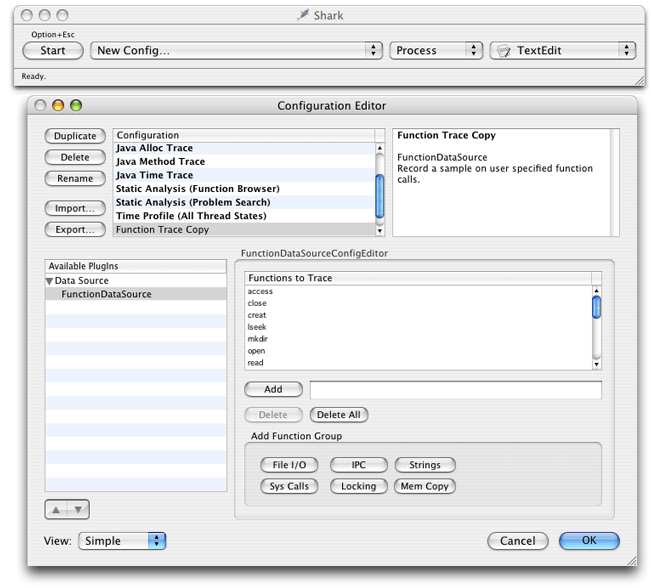
The Shark application lets you selectively find out what file system-related function calls your application makes. When you set up your session configuration, you can tell Shark exactly which function calls you want it to watch. You can specify high-level or low-level calls in your application. Shark even defines a set of default POSIX file I/O functions to watch. This list of functions includes access, close, creat, lseek, mkdir, open, read, readv, rename, rmdir, truncate, unlink, write, writev, getattrlist, setattrlist, getdirentries, and getdirentriesattr. A list of system calls includes all the file I/O calls plus fcntl, flock, fstat, fsync, link, lstat, lstatv, and stat.
Figure 1 shows the Shark Configuration Editor window, which you display by selecting New Config from the sampling configuration popup menu. Before you begin your session, you must create a configuration that includes the functions you want to trace. Once you select the functions, click OK to dismiss the Configuration Editor window. Shark adds your new configuration to the sampling configuration popup menu. Select it and begin sampling.

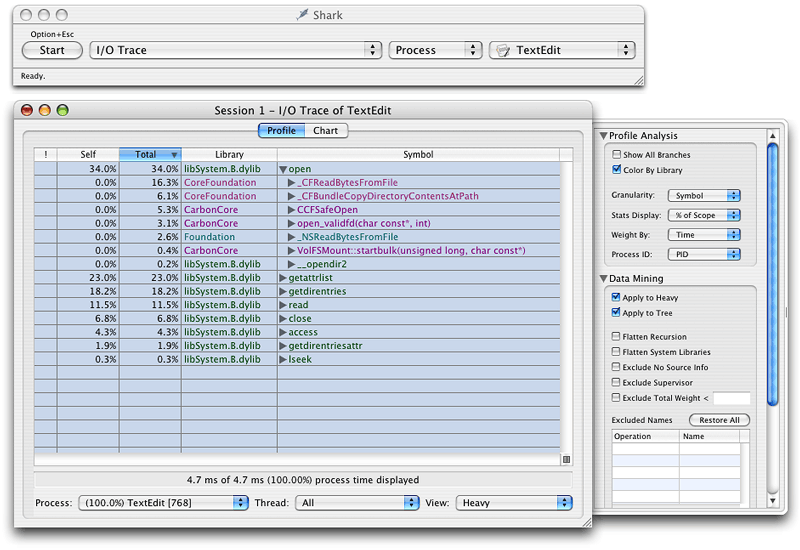
Disk accesses tend to be slow operations, so minimizing unneeded reads, caching data, or minimizing the number of files examined can improve your application’s performance. When you finish sampling, Shark displays the sample window in heavy view mode to highlight the functions you were tracking (Figure 2). You can expand each function to see the points from which it was called.


Shark does not identify the parameters passed to any functions, nor does it display the time taken by each operation to execute. If you need this sort of information, you should use fs_usage in addition to or instead of Shark. See Analyzing File Interactions in Detail for more details.
Analyzing File Interactions in Detail
The fs_usage tool presents an ongoing display of system-call usage statistics related to file-system activity, including page-ins and errors. By default this includes all current processes running on the system, including fs_usage itself. However, you can limit the statistics gathering to include or exclude a specified list of processes.
The fs_usage tool is well suited for the following operations:
detecting redundant file operations
discovering what files your application touches during launch
discovering which files are taking a long time to read
discovering where bad file-related calls are being made
You can also use fs_usage to identify the file-access patterns used by your application. Examining these patterns might point out places where you could optimize your code’s behavior. For example, a slow-launching application might be trying to read from preferences stored on a network file server. Rather than read the preferences from the server each time, you might decide to cache those preferences locally and write them back to the server as needed.
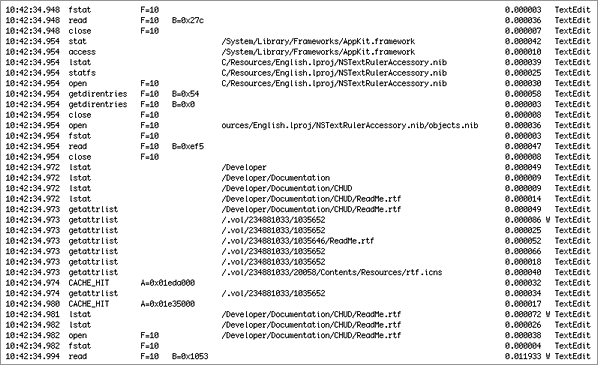
The fs_usage tool formats its output according to the size of your window. A narrow window displays fewer columns of data. Use a wide window for maximum data display. The -w parameter forces all columns to be displayed regardless of the size of the window. Figure 3 shows the output of fs_usage using the -w parameter.

Interpreting the Output of fs_usage
The fs_usage tool continuously generates a large amount of data with millisecond granularity. The output is not updated in place (as with, say, top); instead, each new line of data is appended to the existing data. When running fs_usage for very brief periods of time or during a very specific activity, viewing the information in the Terminal window is possible but time consuming. In most cases, you will probably want to redirect the output of fs_usage to a file so that you can go back and examine it later or run it through a script.
The columns of fs_usage output have no headings and are separated by spaces. You can interpret the type of data in each column by its format. Table 1 describes these columns. If you run the tool without the -w option, some of these columns may be missing.
Column Number | Example | Description |
|---|---|---|
1 |
| Timestamp, giving the time of day when the call occurred. In wide mode, this field has millisecond granularity. |
2 |
| The operation that was detected. Usually, this is the name of a file-system routine or a specific system event, such as a page-in. |
3 |
| Fault address. If the prior column is |
3 |
| File descriptor associated with the call described in the second column (for example, |
4 |
| This column can contain one of three values. It can contain the file offset specified to |
5 |
| The pathname of the file accessed. This value may be truncated but will always display the end of the pathname. Carbon developers should read Technical Q&A QA1113: The “/.vol” Directory and “volfs” for additional information on how to interpret Carbon File Manager calls. |
6 |
| Elapsed time (in microseconds) spent in the system call. A |
7 |
| The name of the executable or application package that made the system call. (Note that Code Fragment Manager applications are named after the native process that launches them, |
Viewing Carbon File Manager Calls
Carbon and Cocoa applications can obtain additional information from fs_usage using the DYLD_IMAGE_SUFFIX environment variable. Setting this variable to the value “_debug“ causes the dynamic linker to use the debug version of the Carbon libraries. Running fs_usage against these libraries causes the tool to display the name of the Carbon File Manager routine that was called in addition to the underlying system routine.
Gathering System Call Statistics with sc_usage
The sc_usage tool displays an ongoing sample of system statistics for a given process, including the number of system calls and page faults. The tool adds new system calls to the list as they are generated by the application being watched. The counts displayed are both the cumulative totals since sc_usage was launched and the delta changes for this sample period. The sc_usage tool also displays the following information:
the amount of CPU time consumed by the process and by each routine
the absolute time during which the process is waiting
the cumulative time a thread has been blocked (identified by number)
the current scheduling priority for the thread
the number of page-ins, copy-on-write operations, zero-fill faults, and faults that hit in the page cache
global state, including the number of preemptions, context switches, threads, faults, and system calls found during the sampling period
Listing 1 shows some sample sc_usage output for the TextEdit application.
Listing 1 Sample output from sc_usage
TextEdit 0 preemptions 0 context switches 1 thread 13:23:55 |
0 faults 0 system calls 0:00:30 |
TYPE NUMBER CPU_TIME WAIT_TIME |
------------------------------------------------------------------------------ |
System Idle 0:05.643( 0:00.965) |
System Busy 0:00.285( 0:00.038) |
TextEdit Usermode 0:00.029 |
zero_fill 17 0:00.000 0:00.000 |
mach_msg_trap 213 0:00.003 0:02.944( 0:01.003) W |
gettimeofday 4 0:00.000 |
mk_timer_create 9 0:00.000 |
mk_timer_destroy 9 0:00.000 |
mk_timer_arm 19 0:00.000 |
mk_timer_cancel 3 0:00.000 |
mach_port_insert_member 13 0:00.000 |
mach_port_extract_membe 13 0:00.000 |
vm_deallocate 17 0:00.000 0:00.000 |
Be aware that the mach_msg_trap kernel routine will always be the system call with the greatest amount of CPU time used. This call indicates that the application is blocked and waiting for something to happen, such as a system event.
Copyright © 2003, 2014 Apple Inc. All Rights Reserved. Terms of Use | Privacy Policy | Updated: 2014-03-10