Debugging On-Demand Resources
As you develop apps that provide on-demand resources you can encounter different types:
Downloading resources. Issues with downloading resources.
Local storage space. Running out of local storage for downloading on-demand resources or for already downloaded resources..
Unexpected state. On-demand resource tags are not in the expected state. For example, a tag shows that it is in use when all parts of the app should have ended access.
Problems Downloading Resources
Problems with downloading resources fall into three categories:
Networking issues
Asset pack size
Nonexistent resources
Networking Issues
Debugging networking issues is made easier with the Reachability sample code. It can check for network connectivity and the type of connection, and it can determine whether a specific host is reachable. You can use the information to isolate common networking problems. For example, if the host is reachable but the resources cannot be downloaded, either the app has the wrong URL for resources, or the host configuration has changed.
Other common network issues include the following:
The device is not connected to the network.
The device is connected to cellular, and the user has turned off data access for the app.
There is connectivity, but the server is not available.
The app is using self-hosted on-demand resources, and the URL for the content has changed.
Asset Pack Sizes
Asset packs that are large can take too long to download. Find these kind of problems by testing the downloads under various conditions. For more information, see Optimization with Testing.
Nonexistent Resources
The error of having nonexistent resources occurs when one or more of the tags in the resource request are invalid.
Calling beginAccessingResourcesWithCompletionHandler: sets the error code to NSBundleOnDemandResourceInvalidTagError.
The error can also happen in a call to conditionallyBeginAccessingResourcesWithCompletionHandler:. Generally this error is due to a typo in the tag list.
The best approach to finding the error is to compare the tags in the NSBundleResourceRequest object against the tags in the project.
Problems with Storage Space
There are two types of problems that can occur with storage space:
The requested resources exceed the maximum in-use memory.
The requested resources exceed the available system memory.
Exceeding Maximum In-Use Memory
Requesting access to resources that exceed the in-use memory happens in a call to beginAccessingResourcesWithCompletionHandler: or conditionallyBeginAccessingResourcesWithCompletionHandler:. The error in the block passed to beginAccessingResourcesWithCompletionHandler: is NSBundleOnDemandResourceExceededMaximumSizeError.
To fix the problem, release in-use on-demand resources. You can release a tag by sending endAccessingResources to NSBundleResourceRequest using the tag. You can also deallocate the resource requests. Remember that a tag can be referred to by multiple resource requests.
For the in-use memory limits, see Platform Sizes for On-Demand Resources.
Exceeding System Memory
The error of exceeding the amount of system memory for on-demand resources can occur in two ways.
The first way to run out of system memory is to request access to resources that require more memory than is currently available. Calling beginAccessingResourcesWithCompletionHandler: when this problem happens sets the error code to NSBundleOnDemandResourceOutOfSpaceError. You can tell how much memory is in use by looking at the debug disk gauge.
The error also happens when the system runs out of space to allocate on-demand resources and needs to free up space in the cache. This error can happen at any time, including when your app is in the background. For information on detecting this storage problem, see Low-Space Warning.
Unexpected State
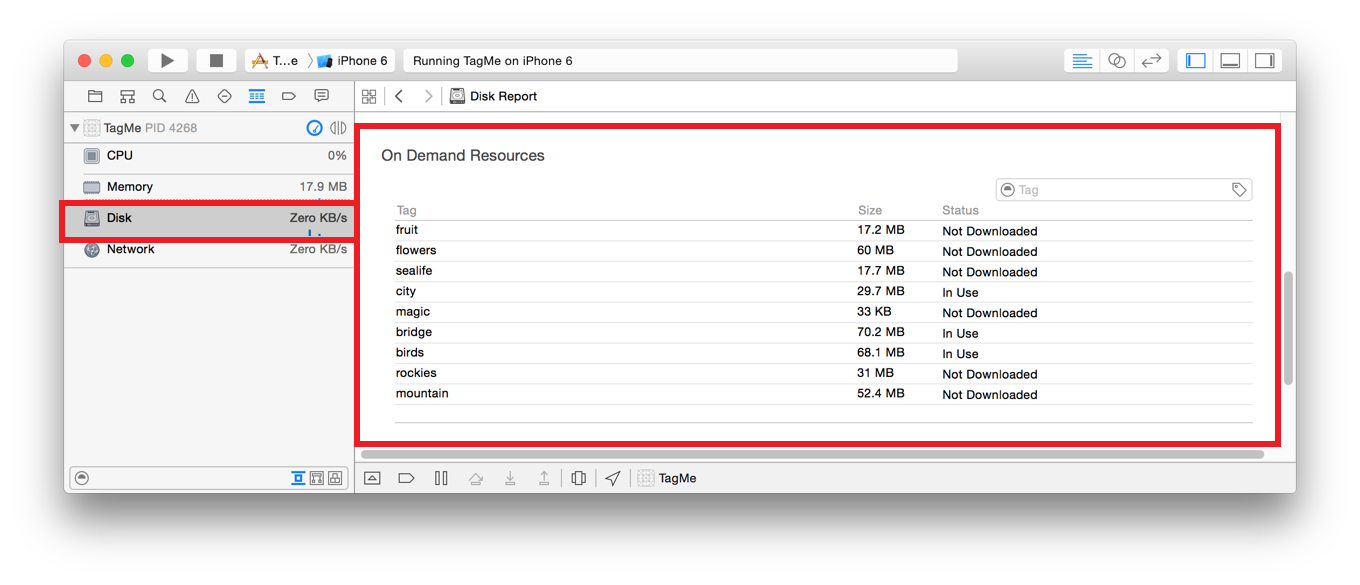
The most useful tool for debugging an unexpected state problem is the disk gauge shown in the debug navigator when your app is run in debug mode. The gauge contains a section for on-demand resources that indicates their current state as shown in Figure 6-1.

The disk gauge shows the size and status for each tag. The size is the slimmed size for the current device.
Tag Status
Table 6-1 gives a description of the possible values for the status of a tag in the disk gauge tool.
Status |
Description |
|---|---|
Not Downloaded |
The tag has not been downloaded to the device during this debug session. |
Partially Downloaded |
The tag is partially downloaded likely due to an interruption in connectivity. |
Downloading |
The tag is downloading. If possible, a progress bar is shown. |
Downloaded |
The tag is on the device and not in use by any |
In Use |
The tag is on the device and in use by the app. |
Purged |
The tag was on the device and has been purged from local storage. Before being used, it must be downloaded. |
Opening the Disk Gauge
You can use the disk gauge when you run your app in debug mode in the simulator or on a device.
Choose View > Navigators > Show Debug Navigator.
Use the Scheme pop-up menu to choose a target and a device.
Choose Product > Run to launch your app.
The app launches on the chosen device, and the debugger attaches to the app.
Click the Disk Gauge icon in the list of gauges in the debug navigator.
The disk gauge appears in the content area of the workspace window.
Scroll down until the On-Demand Resources category is visible.
You may want to resize the content area to show all of your tags.
After the disk gauge is open, use your app and monitor the status of your tags.
Accessing and Downloading On-Demand Resources
Copyright © 2018 Apple Inc. All rights reserved. Terms of Use | Privacy Policy | Updated: 2017-01-12

