Retired Document
Important: This document, which describes Xcode 3, has been superseded in Xcode 4 by the chapter Debugging and Analyzing Your Code from the Xcode Overview.
Debugging Preferences
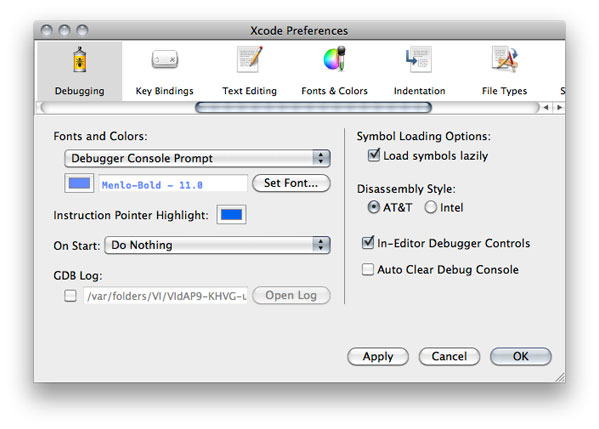
The Debugging pane of Xcode preferences contains options for customizing the debugger console, the text editor debugging experience, and other debugging aspects. Figure 6-1 shows the Debugging preferences pane.

Here’s what the pane contains:
Fonts and Colors: Specifies the color and font used for text in the console.
Instruction Pointer Highlight: Specifies the color used to highlight the location of the instruction pointer in the debugger window when execution of the current program is stopped.
On Start: Specifies actions to perform when you launch a program from Xcode. The actions include showing the console, the debugger, or the mini debugger.
GDB Log: Specifies a file into which GDB logs its activities.
Symbol Loading Options: Specifies symbol loading behavior.
Load symbols lazily: When selected, the debugger defers loading symbols until they are needed. Otherwise, Xcode loads all symbols for the executable and its libraries when you launch it in the debugger. You can further customize which symbols are loaded in the Shared Libraries window. See Viewing Shared Libraries for more information.
Disassembly Style: Specifies the disassembly format used in the text editor and the debugger. See Viewing Disassembly Code and Processor Registers for more information.
In-Editor Debugger Controls: Specifies whether the debugger strip appears in the text editor. See Debugger Strip to learn about the debugger strip.
Auto Clear Debug Console. Specifies whether to clear the debugging console at the start of a debugging session.
Copyright © 2011 Apple Inc. All Rights Reserved. Terms of Use | Privacy Policy | Updated: 2011-03-08