Retired Document
Important: This document no longer represents the most current version of Safari developer tools. Links to downloads and other resources may no longer be valid. For new documentation on Safari Web Inspector, please visit Safari Developer Help.
The Develop Menu
The Develop menu contains a set of tools to assist you in prototyping, debugging, and optimizing your website:
Open Page With—Open the current webpage in another web browser. Any app that registers as a viewer for HTTP URLs appear here.
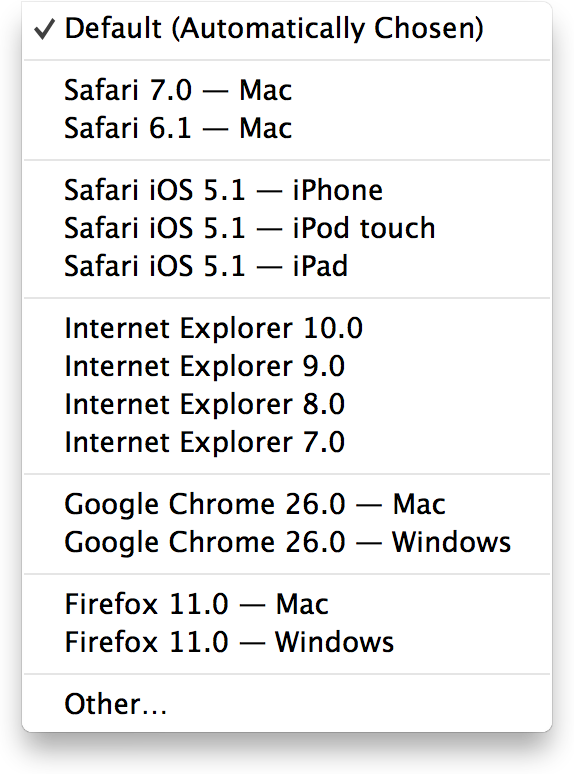
User Agent—Browsers send a user agent string that identifies the browser type and version to the server. The same string is sent in response to a JavaScript request for the user agent string. Use this menu item to modify the user agent string Safari sends, to simulate visiting your site using a different browser or device type. See Changing the User Agent String.
Show Web Inspector—Open Web Inspector.
Show Error Console—Open the console in Web Inspector. See The Console.
Show Page Source—Open the Source Code in Web Inspector to see the HTML of the current page. See Source versus DOM.
Show Page Resources—Open the Resources navigation sidebar in Web Inspector to view all images, scripts, and style sheets attached to the current page. See Resources and the DOM.
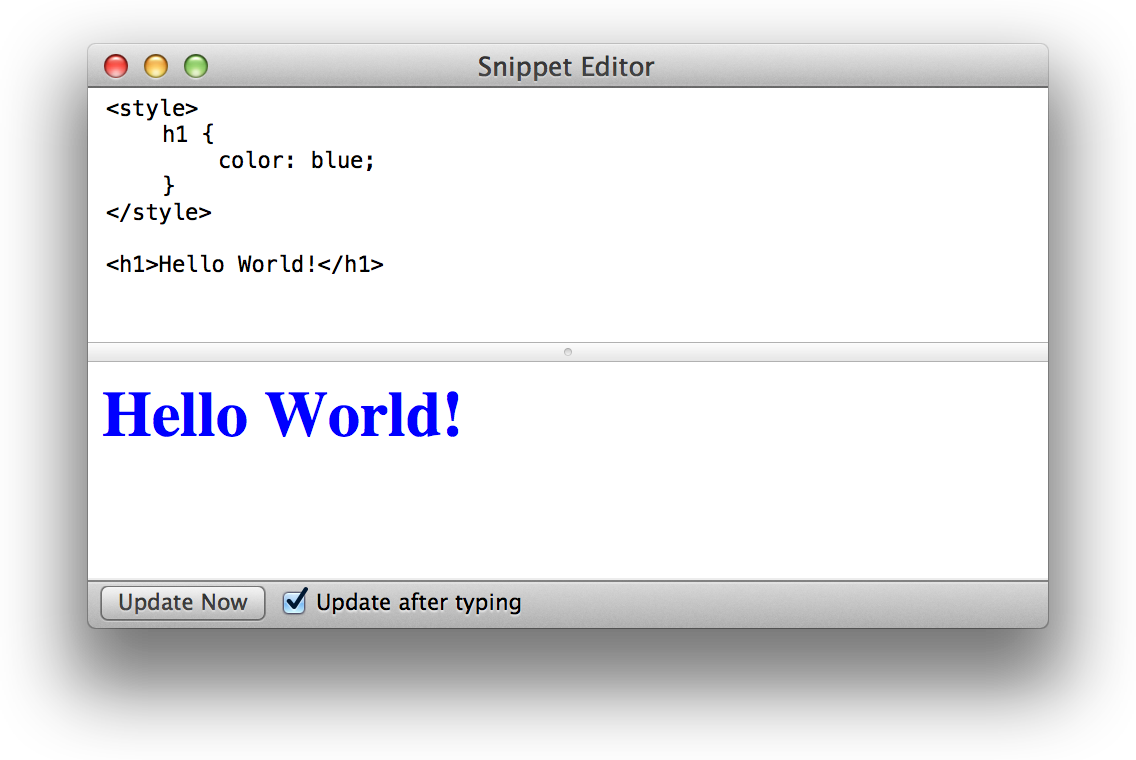
Show Snippet Editor—Open the Snippet Editor window to interactively prototype HTML, CSS, or JavaScript snippets. See Snippet Editor.
Show Extension Builder—Open Extension Builder to install, modify, create, or uninstall a Safari extension. See Safari Extensions Development Guide.
Start Profiling JavaScript—Turn on the JavaScript profiler to see how many times each function is called, how long it takes, and so on. See JavaScript and Events Recording.
Start Timeline Recording—Record detailed information about the status of incoming HTTP requests, JavaScript events, and layout rendering. See Recording Timelines.
Empty Caches—Delete all caches stored by the browser. Select this if you’re suspicious that your webpage is using stale cached content.
Disable Caches—Turn off caching to see how a website loads the first time. Select this if you’re suspicious that your webpage is using stale cached content.
Disable Images—Turn off image display and view websites as text only.
Disable Styles—Turn off CSS style properties to view the page purely as HTML and JavaScript.
Disable JavaScript—View websites with the JavaScript interpreter disabled.
Disable Site-specific Hacks—Use this to disable the modifications to Safari and test your site for correct operation (if Apple engineers have modified Safari specifically to work around a problem with your website).
Disable Local File Restrictions—Disable security checks that may prohibit local development.
Enable WebGL—Turn on the ability to view OpenGL content in Safari.
Allow JavaScript in the Address Bar—Allow JavaScript to be executed on the page by typing
javascript:followed by a valid JavaScript expression in the Address bar.
Changing the User Agent String
Every browser has a user agent string that identifies its type and version number. The browser sends this string to the server. Your website can also use JavaScript to read the user agent string to determine which version of a browser a user is running. You can choose what Safari reports as its user agent from the User Agent submenu.
This can be useful to quickly test your code to see if it is reacting to various user agents as you expect, without having to actually load the page in multiple versions of multiple browsers. The User Agent submenu is shown in Figure A-1.

You can choose the common versions of most popular browsers from the submenu. Note that the list includes the versions of Safari found on iPhone, iPad, and iPod touch.
The Other... menu item opens a sheet showing the default user agent string, which you can edit to any string you like.
Snippet Editor
Snippet Editor provides an interactive sandbox for previewing HTML and CSS, as shown in Figure A-2.

Copyright © 2018 Apple Inc. All Rights Reserved. Terms of Use | Privacy Policy | Updated: 2018-02-07